
The Supply Chain Operations Management Model™
One picture. Two outcomes. Four quadrants.
An operating company is a machine with two simultaneous outputs: the customer’s experience and the financial result. The Model holds both in view at once, breaks each into the disciplines that produce it, and names what has to be true underneath — capable people and systems that are actually used.
Applied across client engagements since 2012.
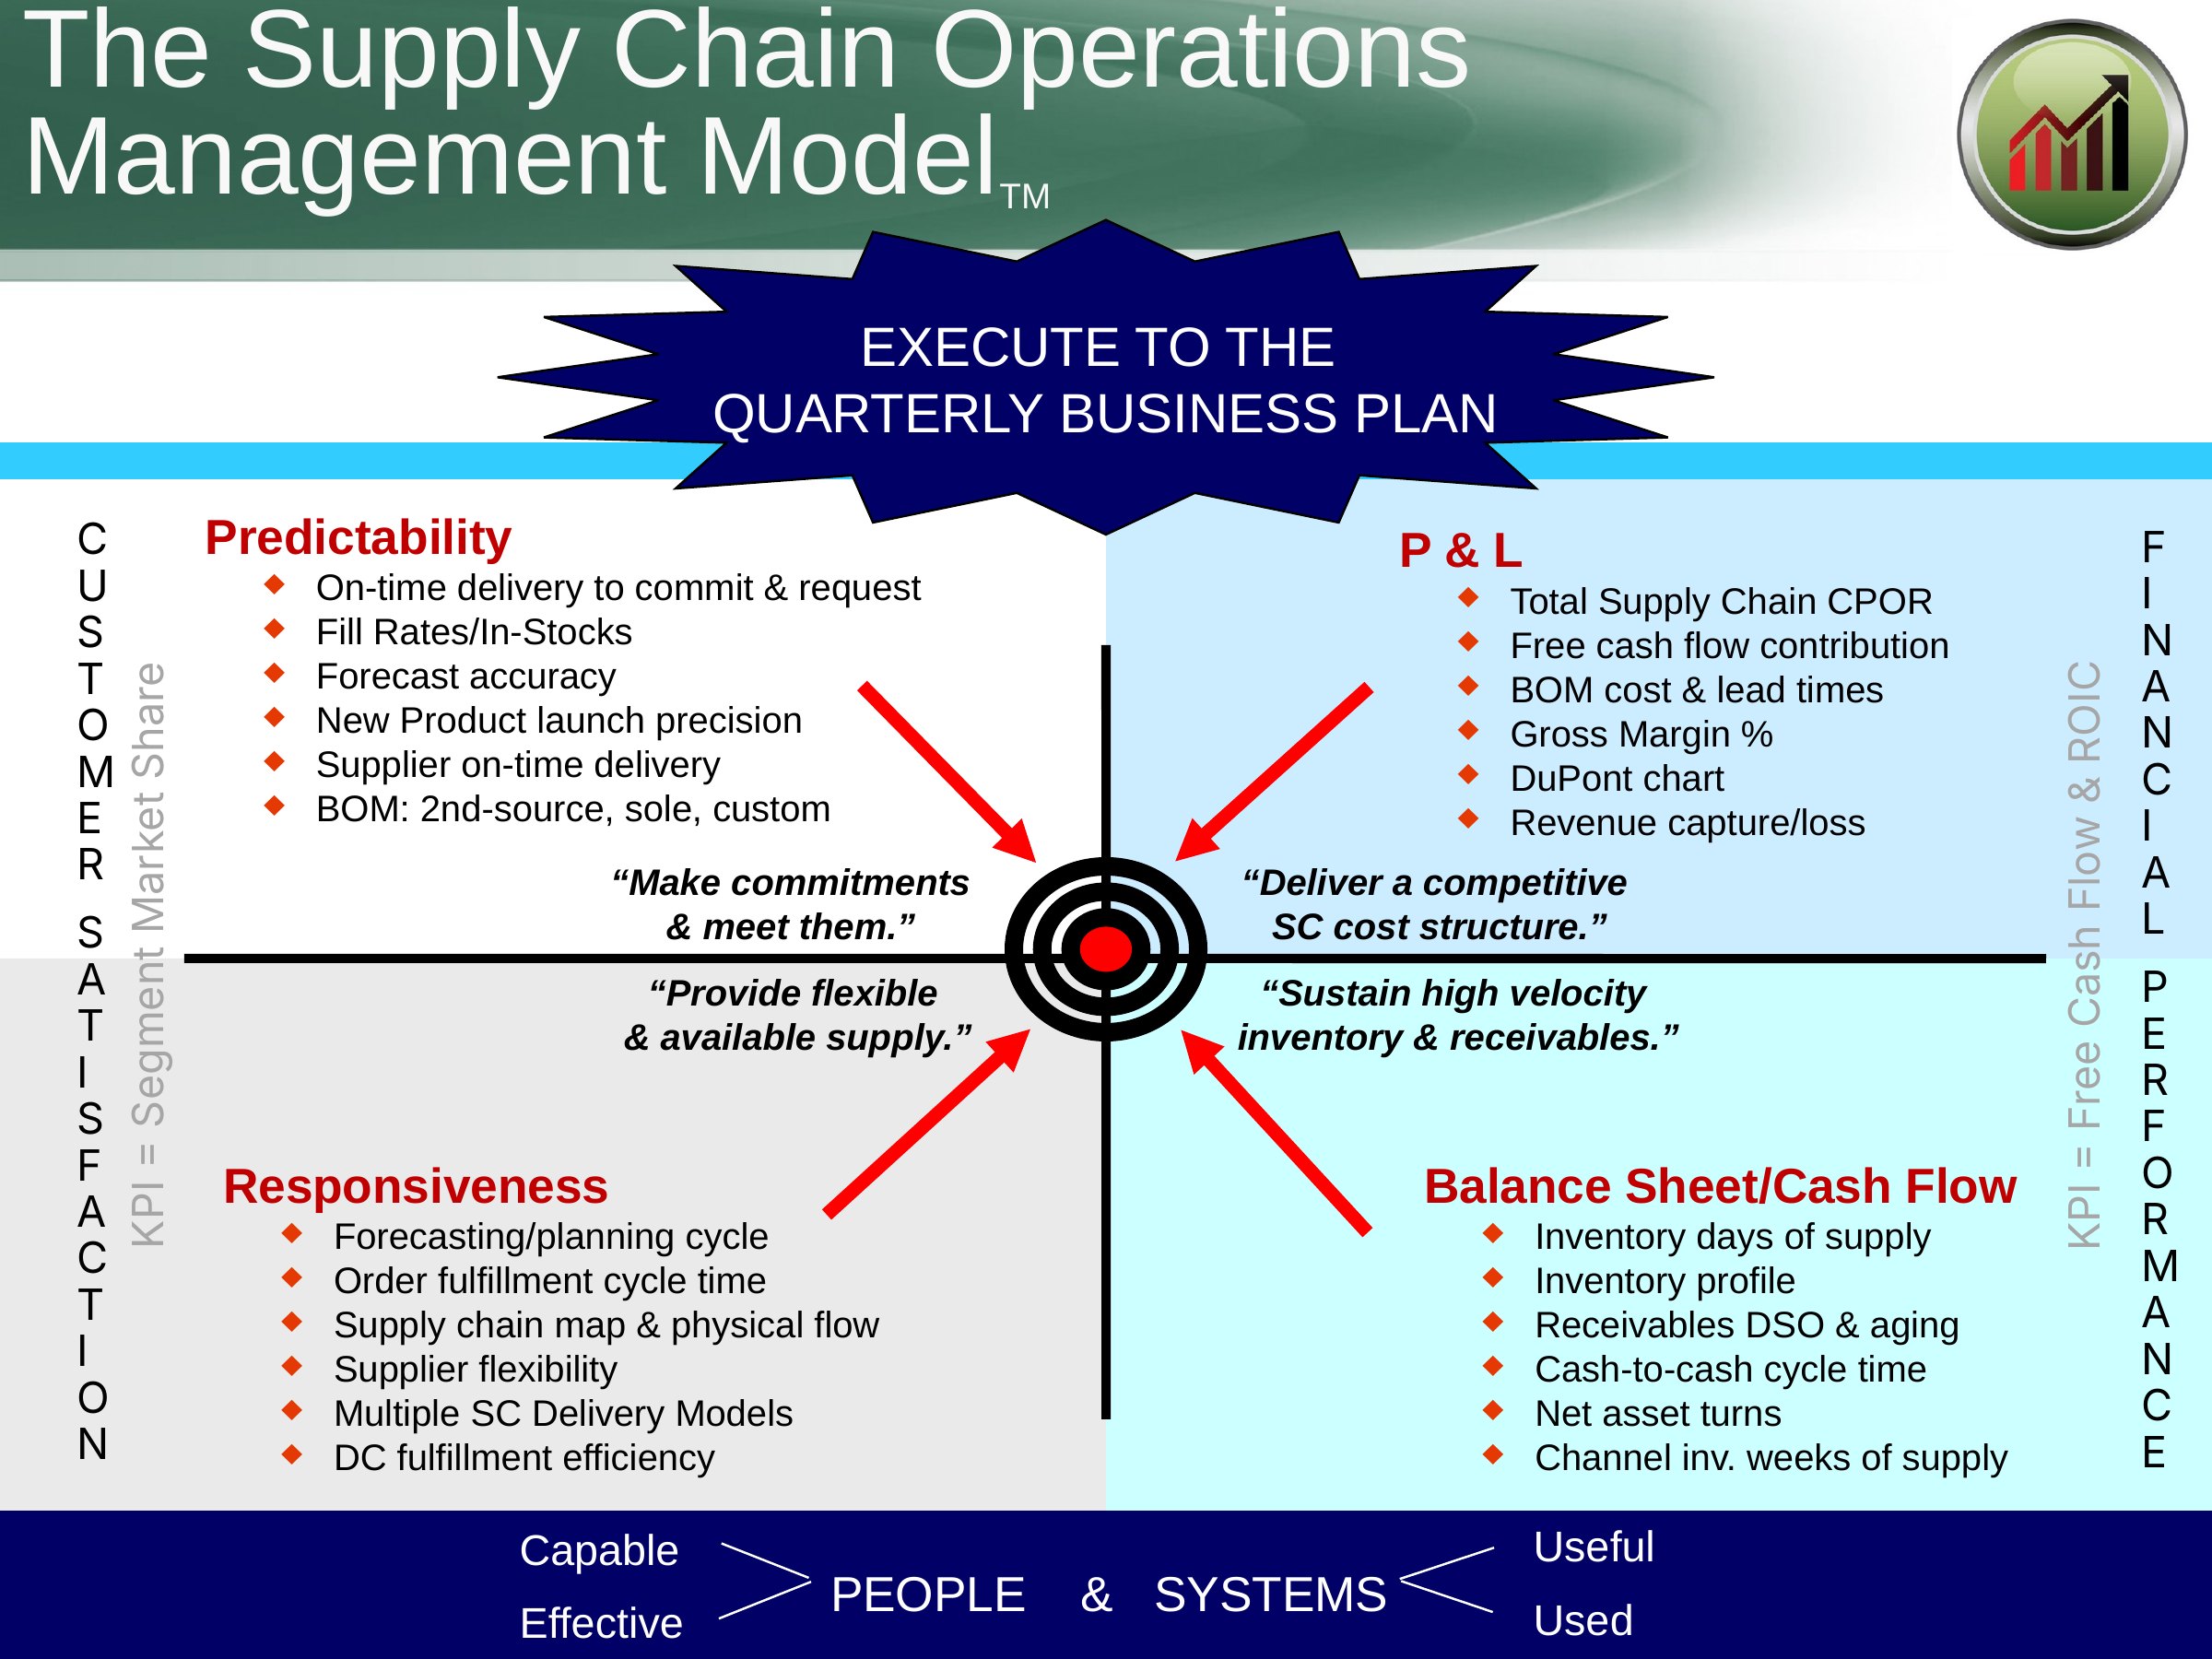
The Supply Chain Operations Management Model™ — © Productivity Specialists LLC · Click the graphic to view full size.
Two outcomes, both non-negotiable
Optimized together — never balanced one at a time.
The input lever
Customer satisfaction
Predictability and responsiveness. The market rewards both with share.
Anchor KPI: segment market share
Share converts into financial results over one to three quarters. Financial discipline funds the next round of customer investment.
The output
Financial performance
A competitive cost structure, and working capital that turns into cash.
Anchor KPIs: free cash flow & ROIC
The four quadrants
Run the inputs. Let the outputs follow.
Each quadrant has a mantra, a question it answers, and six input metrics. The most common operating mistake is chasing the outputs in ways that degrade the inputs.
Customer side · upper left
Predictability
“Make commitments and meet them.”
Answers the customer’s first question: Can I rely on you?
- On-time delivery to commit & request
- Fill rates / in-stocks
- Forecast accuracy
- New product launch precision
- Supplier on-time delivery
- Components: 2nd-source, sole, custom
Financial side · upper right
P&L
“Deliver a competitive supply/demand cost structure.”
Answers the CFO’s question: Is the supply chain affordable — and does it capture revenue we’d otherwise lose?
- Total supply chain CPOR
- Free cash flow contribution
- BOM cost & lead-time profile
- Gross margin %
- DuPont chart
- Revenue capture / loss
Customer side · lower left
Responsiveness
“Provide flexible and available supply.”
Answers the customer’s second question: Can you keep up with me?
- Forecasting / planning cycle
- Order-fulfillment cycle time
- Supply chain map & flow
- Supplier flexibility
- Supply chain delivery models
- DC fulfillment efficiency
Financial side · lower right
Balance sheet & cash flow
“Sustain high-velocity inventory and receivables.”
Answers the Treasurer’s question: Is the supply chain funding itself out of operations?
- Inventory days of supply
- Inventory profile
- Receivables DSO & aging
- Cash-to-cash cycle time
- Net asset turns
- Channel inventory weeks of supply
The frame around the quadrants
A banner on top. A foundation underneath.
Execute to the quarterly business plan
Every metric in every quadrant serves the quarter the business has already promised — to customers, suppliers, employees and investors. Run on a nested cadence: daily exceptions, weekly reviews, the monthly S&OP cycle, a quarterly close-and-replan.
People: capable and effective
Capable means the right skills and judgment in each role. Effective means those people are organized, trained and given clear decision rights so their capability produces results — tested every quarter, not once.
Systems: useful and used
Useful means the system produces what decision-makers need, when they need it. Used means the operating culture actually depends on it — not parallel spreadsheets and side conversations.
The engine at the center
Sales & Operations Planning reconciles it all — every month.
Five ordered steps, each building on the last, ending in an executive decision that becomes the basis for the next cycle. Run well, it is also the most powerful development experience an operating leader can have.
STEP 1 · WEEK 1
New Product Review
Launches, ramps, phase-outs: the pipeline that feeds demand.
STEP 2 · WEEK 2
Demand Review
One agreed, unconstrained demand plan by family and month.
STEP 3 · WEEK 3
Supply Review
Demand tested against capacity, inventory, lead times and risk.
STEP 4 · WEEK 4
Integrated Reconciliation
Demand, supply, inventory and financials in one plan.
STEP 5 · MONTH END
Executive S&OP
Ninety minutes to make the three to seven decisions that matter.
Where does your operation sit?
Companies climb a maturity curve — and the climb takes years.
Shown here for Predictability; each quadrant has its own curve. Knowing your stage is the first step in choosing the right next investment.
1
Reactive
No formal commitment process. Misses managed by expediting. Leaders spend the week firefighting.
2
Rule-based
Published lead times and scorecards exist, but are loosely enforced. Misses are tracked, not prevented.
3
Integrated
Formal exception management with named owners. Suppliers under structured improvement.
4
Predictive
Misses anticipated before they happen. Leaders spend their time on structural improvement.
An Assess engagement scores your operation on all four quadrants — and shows what the next stage is worth in cash.
Forthcoming book